>

Turn Supply Chain Complexity Into Optimized, Confident Decisions

DecisionPlan is the optimization platform that transforms your inventory, network, and planning data into the lowest-cost plan that still hits your service targets. Built on real operations-research modeling — not spreadsheets and gut calls — so your team spends less time reacting and more time deciding.

Request a Demo See It In Action
2
Engines
1
Network Model
6
Step Workflow
5
Phase Rollout

Carry less. Move it for less. Keep your service levels.

  • Works alongside your ERP
  • Explainable, constraint-based math
  • Proven on your own data first
The problem & the solution

Most planning teams are still deciding with yesterday's tools

Where planning breaks down

Inventory, replenishment, and network decisions get made in spreadsheets, built on static safety-stock rules of thumb, and revisited only when something breaks. Suppliers, warehouses, lead times, capacity limits, and lane constraints all interact — but they're rarely modeled together, so planners either overstock to stay safe (tying up working capital) or undertrust to save cash, risking service failures and stockouts.

Testing a "what-if" scenario means days of manual rework, so most teams never test it at all — they commit to a plan and hope.

DecisionPlan replaces hope with math

It's an operations-research-based optimization platform that models your entire network — suppliers, warehouses, customers, products, and lead times — and computes the procurement, inventory, transfer, and fulfillment plan that minimizes total cost while meeting your service and inventory policies.

Instead of a static report, you get a live control tower: build a scenario, validate the data automatically, run the optimization, and see exactly where cost, service, and inventory move — down to the SKU and location — before you commit to anything.

One platform, two connected engines

Get the inventory right. Then get the movement right.

Planning decides the volume and where it sits. Execution decides how it moves each day. DecisionPlan solves both against the same network model, so the weekly plan and the daily dispatch never contradict each other.

Weekly planning

Inventory Optimization

Get the inventory right

  • How much inventory to hold
  • Where to position it across warehouses
  • When to replenish, and how much to order
  • Balance inventory cost against customer service
OrderExpediteTransferDeferCancelStop buying
Daily execution

Logistics OptimizationEARLY ACCESS

Get the movement right

  • Which orders to move today
  • From which warehouse, and on which truck
  • How to consolidate loads
  • Maximise truck utilisation within priorities, capacity and SLAs
Order allocationTruck assignmentLoad consolidationFTL / LTL

Availability: Logistics Optimization follows Inventory Optimization. Early-access engagements run alongside a live inventory deployment.

Together: companies carry less inventory, cut logistics cost, use their trucks and warehouses better, and hold service levels, through one connected optimization platform.
Where it sits

The optimization layer between your S&OP plan and your ERP

Most S&OP processes set direction monthly and weekly, but cost and service are decided daily in inventory and logistics. DecisionPlan connects the two mathematically. Your ERP stays the system of record.

Input

Demand & supply signals

ERP and planning data

Plan

S&OP cycle

Strategic and tactical plans

Optimize

DecisionPlan engine

Weekly inventory + daily logistics

Decide

Planner review

Approve or adjust

Execute

ERP execution

POs, transfers, dispatch

Not a chatbot

AI explains and answers questions. The optimization engine calculates the best feasible decision under your real constraints. The copilot sits on top of the math, not in place of it.

Not your ERP

No rip-and-replace. Your ERP keeps running orders, transfers and dispatch. DecisionPlan generates better decisions and hands them back for execution.

Not just a dashboard

Dashboards show what happened. DecisionPlan produces recommendations your planners can review, approve and execute, with the KPIs to check they worked.

Scenario Manager

A guided, six-step optimization workflow

Create a scenario, upload or connect your data, and let DecisionPlan validate it automatically before anything runs. From raw data to an optimized plan — without needing a data science team in the loop.

Step 1 of 6

Define the scope of the run

Name the scenario, set the planning horizon and pick the optimization module. Everything downstream — validation, solve and comparison — is scoped to this definition, so two planners can never accidentally compare runs built on different assumptions.
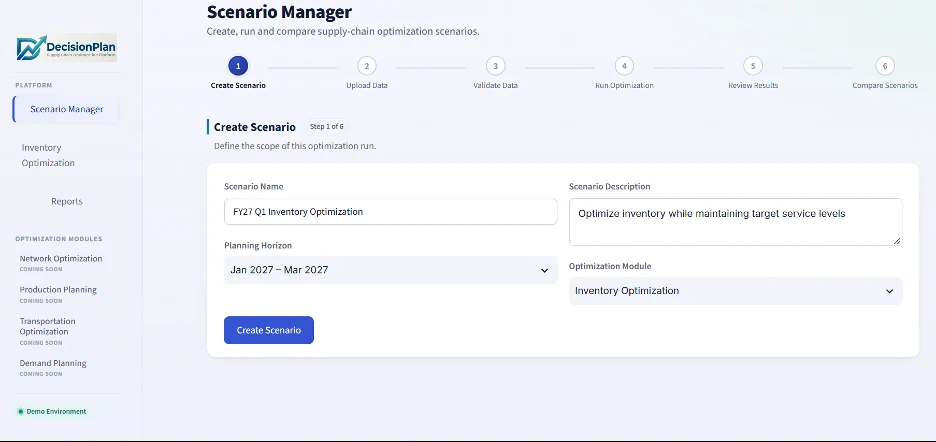
Planning horizon
Jan – Mar 2027
Optimization module
Inventory
DecisionPlan Scenario Manager — Create Scenario form with scenario name, planning horizon and optimization module fields, and the six-step progress tracker across the top

Step 1 — scenario definition, with the six-step tracker showing exactly where the run stands.

Step 2 of 6

Load twelve standard input files

Point DecisionPlan at your data folder or connect the feed from your ERP. Every file is checked on arrival — row counts, column counts and a per-file validation status — so you know the model is reading what you think it is.

Files
12
Demand rows
832
Lane records
144
Errors
0
12 of 12 files loaded and confirmed from scenario '01_normal_optimized'
File nameRowsColsValidation
01_products.csv106✓ Valid
02_suppliers.csv52✓ Valid
03_warehouses.csv105✓ Valid
04_customers.csv505✓ Valid
05_supplier_warehouse_lanes.csv246✓ Valid
06_warehouse_customer_lanes.csv1005✓ Valid
07_warehouse_warehouse_lanes.csv205✓ Valid
08_demand.csv8324✓ Valid
09_opening_inventory.csv453✓ Valid
10_supplier_capacity.csv653✓ Valid
11_safety_stock.csv453✓ Valid
12_inventory_parameters.csv454✓ Valid
Step 3 of 6

Structural and referential checks

Eight automated checks run before a single variable is solved. A scenario cannot proceed on data that would quietly produce a misleading plan — so the answer you get is never undermined by a broken reference or a duplicate key.

Products
10
Suppliers
5
Warehouses
10
Customers
50
PASSED
Required columns — all required columns present across the 12 input files.
PASSED
Data types — all numeric fields parse cleanly and sit within expected ranges.
PASSED
Blank values — no blank values in required fields.
PASSED
Duplicate records — no duplicate key records found in any file.
PASSED
Number of entries — every file's row count reconciled against the model.
PASSED
Unique SKUs — 10 unique SKUs in the product master; all references resolve.
PASSED
Unique locations — 10 unique warehouse locations; all references resolve.
PASSED
Referential integrity — supplier, customer and warehouse references resolve across lane, demand and inventory files.
Step 4 of 6

Run the real solver, not an estimate

DecisionPlan executes a genuine mixed-integer optimization model on the HiGHS solver against your scenario. Runs take anywhere from a few seconds to a few minutes depending on problem size — and the run reports whether the solution is feasible and optimal, so you always know what you're looking at.

Solver
HiGHS
Status
Optimal
› Running optimization model…
01_products/inventory-optimization/src/run.py
scenario  01_normal_optimized
solver    HiGHS · mixed-integer
horizon   13 weeks
✓ status: optimal
✓ outputs written — supply orders, warehouse transfers, distribution flows, inventory, shortages, safety stock shortfalls
Run Optimization ▶

The solver writes full result files back to the scenario's output folder — every recommendation is inspectable, not a black box.

Step 5 of 6

See exactly where the cost sits

The run returns a full cost decomposition plus the volume of every decision it made. Planners see the trade-off the optimizer chose — and can trace any number back to the cost, capacity or policy that drove it.

Figures shown are from a demo scenario: 10 SKUs, 5 suppliers, 10 warehouses, 50 customers, 13-week horizon.

Total cost
₹261,766
Procurement
₹0
Distribution
₹10,059
Warehouse transfer
₹5,167
Holding
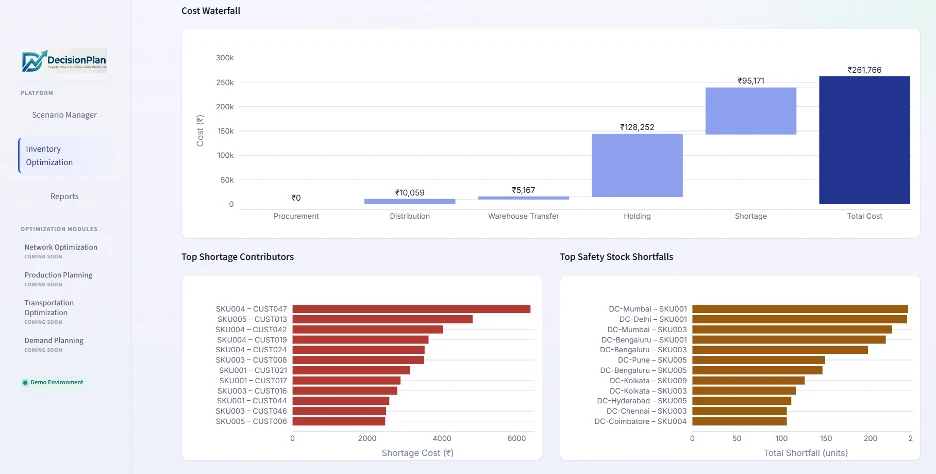
₹128,252
Shortage
₹95,171
Supply orders
0
WH transfers
120
Dist. flows
379
Inventory rows
585
Shortages
483
Step 6 of 6

Compare runs, decide the trade-off yourself

Put optimized runs side by side — a normal plan, a demand surge, a demand drop — and see how total cost redistributes across holding, shortage and transfer. DecisionPlan applies no ranking: it shows the trade-offs and leaves the judgement to your planners.

This is the "what-if" that used to take days of manual rework — now it's a second run.
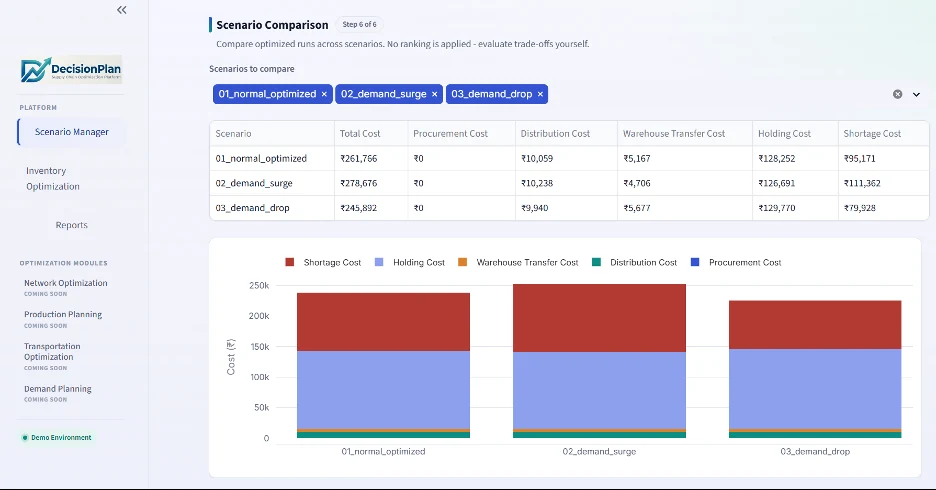
DecisionPlan scenario comparison — a table of three optimized scenarios with their cost breakdown, above a stacked bar chart comparing shortage, holding, transfer, distribution and procurement cost

Step 6 — three optimized scenarios compared across every cost component.

What-if analysis

Three scenarios. One honest trade-off.

The same network, optimized under three different demand assumptions. Total cost moves — but so does where that cost sits, which is the decision your planners actually need to make.

ScenarioTotal costProcurementDistributionWH transferHoldingShortage
01_normal_optimized₹261,766₹0₹10,059₹5,167₹128,252₹95,171
02_demand_surge₹278,676₹0₹10,238₹4,706₹126,691₹111,362
03_demand_dropLOWEST COST₹245,892₹0₹9,940₹5,677₹129,770₹79,928

Demo scenario data. Lowest total cost is highlighted for orientation only — DecisionPlan deliberately applies no ranking, because the right plan depends on how you weigh service against working capital.

Inventory Optimization

From network KPIs down to a single SKU

Every run produces an executive view, a diagnostic breakdown and a drill-down — so a planner can go from "total cost moved" to "which warehouse-product pair caused it" without leaving the screen.
Total cost
₹261,766
Across the 13-week horizon
Service level
41.9%
Against a 96.5% target policy
Inventory value
₹122,764
Working capital held in stock
Total shortage units
8,819
Unmet demand, quantified
Safety stock shortfalls
87
Across 31 warehouse-product pairs
Warehouse utilization
1.8%
Capacity headroom for growth
Procurement
₹0
Distribution
₹10,059
WH transfer
₹5,167
Holding
₹128,252
Shortage
₹95,171

Inventory Trend

Inventory value across the 13-week planning horizon
120k157k193k230k W01W06W11W13

Service Level Trend

Weekly service level against the 96.5% target policy
96.5% target 0255075100 W01W06W11W13

Inventory by Warehouse

Final planning week · inventory value by distribution centre
DC-CoimbatoreDC-MumbaiDC-ChennaiDC-DelhiDC-KolkataDC-PuneDC-BengaluruDC-HyderabadDC-VijayawadaDC-Visakhapatnam 010k20k₹ value

Inventory by Category

Final planning week · where the working capital sits
025k50k75k ₹68k₹36k₹12k₹8k IndustrialElectronicsAccessoriesConsumables
DecisionPlan Inventory Optimization dashboard — a cost waterfall from procurement through holding and shortage to total cost, with top shortage contributors and top safety stock shortfalls charted beneath

The cost waterfall shows how total cost is built up; the two charts beneath rank the SKU-customer pairs and warehouse-product pairs driving it.

The recommended action

The key output of an inventory run is an inter-warehouse rebalancing plan — every transfer specified from warehouse, to warehouse, product, week and quantity, in whole units, ready for a planner to approve.

Transfers
120
Units moved
5,753
Transfer cost
₹5,164
Lanes used
19

Drill down to the cause

Start from inventory by warehouse, shortage contributors or safety stock shortfalls, then narrow to a warehouse-product pair to see its on-hand position against safety stock, units shipped and the weeks where cover runs out.

  • Inventory position vs safety stock, week by week
  • Units shipped to customers
  • Top shortage contributors by SKU and customer
  • Recommended transfer plan per lane
The model

Built on the real constraints of your network

DecisionPlan is a mixed-integer and linear optimization model, not a black-box AI system. Every recommendation can be traced back to a cost, a capacity or a policy.

Network scope

  • Multiple suppliers
  • Multiple warehouses
  • Multiple customers
  • Multiple products
  • Multi-week horizon
  • Supplier, warehouse and customer flows

Constraints respected

  • Inventory balance across every warehouse and period
  • Customer demand fulfilment
  • Supplier capacity and lane availability
  • Supplier and transfer lead times
  • Safety stock and min / max inventory levels
  • Product and warehouse restrictions
Objective function
Minimise procurement + transfer + distribution + holding + shortage cost
while meeting your service and inventory policy.
What you measure

The KPIs that show whether the plan is working

Capital efficiency

  • Inventory value
  • Working capital
  • Days of inventory
  • Inventory turns

Service performance

  • Service level
  • Fill rate
  • Stockouts
  • Safety stock shortfalls

Cost to serve

  • Transportation cost
  • Holding cost
  • Truck utilisation
  • Total supply-chain cost
Planners drill from the network down to a single warehouse and SKU: inventory position against safety stock, units shipped, top shortage contributors and the recommended transfer plan.
Proof of Value

We quantify the opportunity on your data, before you commit

The right savings number depends on your planning process, data quality, inventory profile and network. So we don't quote a fixed percentage. We run DecisionPlan on your own historical data and compare it with the plan you actually ran.

Inventory Optimization

  • Inventory reduction
  • Working-capital release
  • Service-level improvement
  • Less excess and less shortage

Logistics OptimizationEARLY ACCESS

  • Logistics cost
  • Truck utilisation
  • Number of movements
  • FTL / LTL mix
  • SLA performance
Getting started

Deploys alongside your ERP, not instead of it

1

Data readiness check

Review demand, inventory, ERP and logistics data.

2

Proof of Value

Optimize your history and compare with your current plan.

3

ERP integration

Connect data feeds and configure business rules.

4

Inventory Optimization live

Weekly plans to planners for approval.

5

Logistics Optimization live

Daily dispatch plans, training and go-live support.

Questions we get

Before you ask

Do we have to replace our ERP?
No. DecisionPlan reads from your ERP and planning data and returns recommendations. Purchase orders, transfers and dispatch still execute in your ERP, after a planner approves them.
What data do you need?
The twelve standard model inputs: products, suppliers, warehouses and customers; supplier → warehouse, warehouse → customer and warehouse → warehouse lanes; demand, opening inventory, supplier capacity, safety stock and inventory parameters. Every file is validated before a run starts — required columns and data types, blanks and duplicates, unique SKUs and locations, and referential integrity across lanes, demand and inventory.
Is this AI? Can we trust the output?
The engine is a mixed-integer and linear optimization model, not a black-box AI system. Every recommendation traces back to a cost, a capacity or a policy you configured, and the run reports whether the solution is feasible and optimal. AI sits on top as a copilot that explains results and answers questions — it does not make the decision.
How much will we save?
We don't quote a fixed percentage, because the honest answer depends on your planning process, data quality, inventory profile and network. We run DecisionPlan on your own historical data in a Proof of Value and compare the optimized plan against the plan you actually ran — so the number you see is measured on your network, not benchmarked from someone else's.
Can we start with inventory only?
Yes. Inventory Optimization goes live first, delivering weekly plans for planner approval. Logistics Optimization follows as a later phase, with daily dispatch plans, training and go-live support. Both engines solve against the same network model, so adding the second one later doesn't invalidate the first.

Let's quantify your opportunity

Start with a data readiness check. We'll tell you what DecisionPlan can measure on your network and what a Proof of Value would involve.
